
Why a camera health score can give false confidence

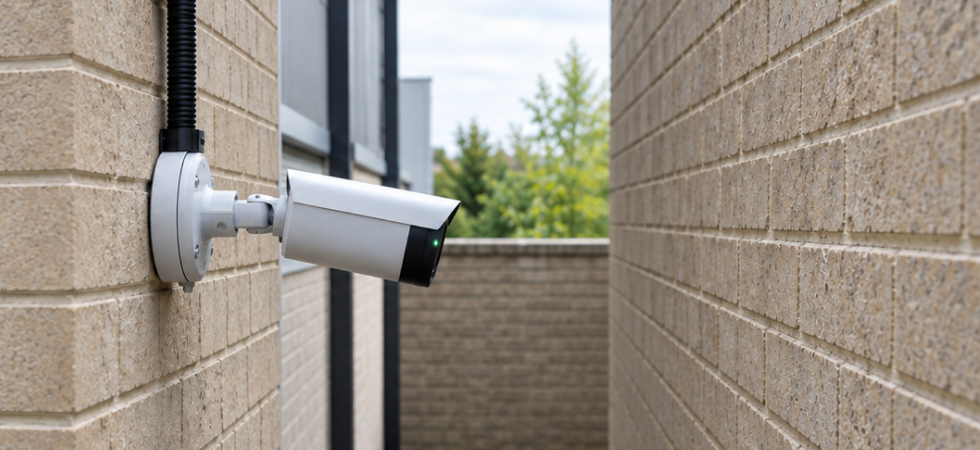
Somewhere in the monthly report there’s a percentage. Estate health: 98%.
That number is doing far less work than it looks like it’s doing.
Uptime is an average, and averages hide the thing you need to know
A single estate-wide health figure is based on a set of cameras that are not comparable to one another. The camera on the delivery entrance and the camera pointed at a storeroom nobody enters after 4pm each count as one. Fifty cameras, one down, 98%.
The percentage tells you how many cameras have a problem. It doesn’t tell you whether the problem matters.
That’s tolerable when an estate is small enough for someone to know every camera personally. It stops being tolerable at a few hundred cameras across a dozen sites, which is the reality for many ARCs and multi-site operators. At that scale the percentage becomes the only thing anyone looks at. It’s also the one piece of information guaranteed not to tell you where your exposure is.
“Online” and “working” are different claims
Then there’s the harder problem. A lot of camera health reporting still starts with whether a camera or stream is reachable. That’s a network question, not a monitoring question.
Nobody finds out until footage is requested and isn’t useful. By then the health report has been green for a month, which makes it worse than no report at all. It was actively reassuring, while the gap existed.
Reliability should be weighted by what a camera covers
What matters is coverage-weighted: for each camera, what would you be blind to if this failed right now, and for how long?
That reframing changes what a health report is for. It stops being a score and becomes a question about exposure: which of the cameras that carry real consequences can’t currently do their job, and who is fixing them.
A report like that is less flattering. Two failed cameras out of five hundred looks like nothing at 99.6%. It looks rather different when both are entrance cameras at a site you’re contractually monitoring, and they’ve been degraded for an indeterminable amount of time.
Why uptime remains the default metric
Reachability is relatively easy to measure. It can be polled automatically across an estate without requiring someone to assess the operational importance of each camera.
Coverage weighting is harder. It requires somebody to decide which cameras carry greater operational consequences, document that decision, and keep the classification current as sites change.
What to do instead
Start with a classification pass. Go through the estate and mark, per camera, what it covers and what its failure would cost. Most estates have never had this written down anywhere. It’s usually a day’s work per site, and it immediately tells you which failures should be escalating differently from the rest.
Then change what the report answers. Not “what proportion of the estate is healthy,” but three questions:
- Which cameras covering something consequential are currently unable to see?
- How long has each been in that state?
- Who owns the fix, and when did they get told?
That report is harder to produce and considerably harder to look at. It’s also the only version that survives contact with a client asking what they actually paid for.
Does your camera health reporting distinguish a covered entrance from an empty corridor?
Related Articles